Balancing Risk and Reward to Develop an Optimal Hot-Hand Game
by Paul Williams, Keith V. Nesbitt, Ami Eidels, David ElliottAbstract
This paper explores the issue of player risk-taking and reward structures in a game designed to investigate the psychological phenomenon known as the ‘hot hand’. The expression ‘hot hand’ originates from the sport of basketball, and the common belief that players who are on a scoring streak are in some way more likely to score on their next shot than their long-term record would suggest. There is a widely held belief that players in many sports demonstrate such streaks in performance; however, a large body of evidence discredits this belief. One explanation for this disparity between beliefs and available data is that players on a successful run are willing to take greater risks due to their growing confidence. We are interested in investigating this possibility by developing a top-down shooter. Such a game has unique requirements, including a well-balanced risk and reward structure that provides equal rewards to players regardless of the tactics they adopt. We describe the iterative development of this top-down shooter, including quantitative analysis of how players adapt their risk taking under varying reward structures. We further discuss the implications of our findings in terms of general principles for game design.
Key Words: risk, reward, hot hand, game design, cognitive, psychology
Introduction
Balancing risk and reward is an important consideration in the design of computer games. A good risk and reward structure can provide a lot of additional entertainment value. It has even been likened to the thrill of gambling (Adams, 2010, p. 23). Of course, if players gamble on a strategy, they assume some odds, some amount of risk, as they do when betting. On winning a bet, a person reasonably expects to receive a reward. As in betting, it is reasonable to expect that greater risks will be compensated by greater rewards. Adams not only states that “A risk must always be accompanied by a reward” (2010, p. 23) but also believes that this is a fundamental rule for designing computer games.
Indeed, many game design books discuss the importance of balancing risk and reward in a game:
- “The reward should match the risk” (Thompson, 2007, p.109).
- “... create dilemmas that are more complex, where the players must weigh the potential outcomes of each move in terms of risks and rewards” (Fullerton, Swain, & Hoffman, 2004, p.275).
- “Giving a player the choice to play it safe for a low reward, or to take a risk for a big reward is a great way to make your game interesting and exciting” (Schell, 2008, p.181).
Risk and reward matter in many other domains, such as stock-market trading and sport. In the stock market, risks and rewards affect choices among investment options. Some investors may favour a risky investment in, say, nano-technology stocks, since the high risk is potentially accompanied by high rewards. Others may be more conservative and invest in solid federal bonds which fluctuate less, and therefore offer less reward, but also offer less risk. In sports, basketball players sometimes take more difficult and hence riskier shots from long distance, because these shots are worth three points rather than two.
Psychologists, cognitive scientists, economists and others are interested in the factors that affect human choices among options varying in their risk-reward structure. However, stock markets and sport arenas are ‘noisy’ environments, making it difficult (for both players and researchers) to isolate the risks and rewards of any given event. Computer games provide an excellent platform for studying, in a well-controlled environment, the effects of risk and reward on players’ behaviour.
We examine risk and reward from both cognitive science and game design perspectives. We believe these two perspectives are complementary. Psychological principles can help inform game design, while appropriately designed games can provide a useful tool for studying psychological phenomena.
Specifically, in the current paper we discuss the iterative, player-centric development (Sotamma, 2007) of a top-down shooter that can be used to investigate the psychological phenomenon known as the ‘hot hand’. Although the focus of this paper is on the process of designing risk-reward structures to suit the design requirements of a hot-hand game, we begin with an overview of this phenomenon and the current state of research. In subsequent sections we describe three stages of game design and development. In our final section we relate our findings back to more general principles of game design.
The Hot Hand
The expression ‘hot hand’ originates from basketball and describes the common belief that players who are on a streak of scoring are more likely to score on their next shot. That is, they are on a hot streak or have the ‘hot hand’. In a survey of 100 basketball fans, 91% believed that players had a better chance of making a shot after hitting their previous two or three shots than after missing their previous few shots (Gilovitch, Vallone, & Tversky, 1985).
While intuitively these beliefs and predictions seem reasonable, seminal research found no evidence for the hot hand in the field-goal shooting data of the 1980-81 Philadelphia 76ers, or the free-throw shooting data of the 1980-81 and 1981-82 Boston Celtics (Gilovitch et al., 1985). With few exceptions, subsequent studies across a range of sports confirm this surprising finding (Bar-Eli, Avugos, & Raab, 2006) - suggesting that hot and cold streaks of performance could be a myth.
However, results of previous hot hand investigations reveal a more complicated picture. Specifically, previous studies suggest that a distinction can be made between tasks of ‘fixed’ difficulty and tasks of ‘variable’ difficulty. A good example of a ‘fixed’ difficulty task is free-throw shooting in basketball. In this type of shooting the distance is kept constant, so each shot has the same difficulty level. In a ‘variable’ difficulty task, such as field shooting during the course of a basketball game, players may adjust their level of risk from shot-to-shot, so the difficulty of the shot varies depending on shooting distance, the amount of defensive pressure, and the overall game situation.
Evidence suggests it is possible for players to get on hot streaks in fixed difficulty tasks such as horseshoe pitching (Smith, 2003), billiards (Adams, 1996), and ten-pin bowling (Dorsey-Palmenter & Smith, 2004). In variable difficulty tasks, however, such as baseball (Albright, 1993), basketball (Gilovitch et al., 1985), and golf (Clark, 2003a, 2003b, 2005), there is no evidence for hot or cold streaks - despite the common belief to the contrary.
The most common explanation for the disparity between popular belief (hot hand exists) and actual data (lack of support for hot hand) is that humans tend to misinterpret patterns in small runs of numbers (Gilovitch et al., 1985). That is, we tend to form patterns based on a cluster of a few events, such as a player scoring three shoots in a row. We then use these patterns to help predict the outcome of the next event, even though there is insufficient information to make this prediction (Tversky & Kahneman, 1974). In relation to basketball shooting, after a run of three successful shots, people would incorrectly believe that the next shot is more likely to be successful than the player’s long term average. This is known as the hot-hand fallacy.
A different explanation for this disparity suggests shooters tend to take greater risks during a run of success, for no loss of accuracy (Smith, 2003). Under this scenario, a player does show an increase in performance during a hot streak - as they are performing a more difficult task at the same level of accuracy. This increase in performance may in turn be reflected in hot hand predictions, however would not be detected by traditional measures of performance. While this hypothetical account receives tentative support by drawing a distinction between fixed and variable difficulty tasks (as the hot hand is more likely to appear in fixed-difficulty tasks, where players cannot engage in a more difficult shot), this hypothesis requires further study.
Unfortunately, trying to gather more data to investigate the hot hand phenomenon from sporting games and contests is fraught with problems of subjectivity. How can one assess the difficulty of a given shot over another in basketball? How can one tell if a player is adopting an approach with more risk?
An excellent way to overcome this problem is to design a computer game of ‘variable’ difficulty tasks that can accurately record changes in player strategies. Such a game can potentially answer a key question relevant to both psychology and game design - how do people (players) respond to a run of success or failure (in a game challenge)?
The development of this game, which we call a 'hot hand game', is the focus of this paper. Such a game requires a finely tuned risk and reward structure, and the process of tuning this structure provides a unique empirical insight into players risk taking behaviour. At each stage of development we test the game to measure how players respond to the risk and reward structure. We then analyse these results in terms of player strategy and performance and use this analysis to inform our next stage of design.
This type of design could be characterised as iterative and player-centric (Sotamaa, 2007). While the game design in this instance is simple, due to the precise requirements of the psychological investigation, player testing is more formal than might traditionally be used in game development. Consequently, changes in player strategy can be precisely evaluated. We find that even subtle changes to risk and reward structures impact on player’s risk-taking strategy.
Game Requirements and Basic Design
A hot hand game that addresses how players respond to a run of success or failure has special requirements. First and foremost, the game requires a finely-tuned risk and reward structure. The game must have several (5-7), well-balanced risk levels, so that players are both able and willing to adjust their level of risk in response to success and failure. If, for example, one risk level provides substantially more reward than any other, players will learn this reward structure over time, and be unlikely to change strategy throughout play. We would thus like each risk level to be, for the average player, equally rewarding. In other words, regardless of the level of risk adopted, the player should have about the same chance of obtaining the best score.
The second requirement for an optimal hot hand game is that it allows measurement of players’ strategy after runs of both successes and failures. If people fail most of the time, we will not record enough runs of success. If people succeed most of the time, we will not observe enough runs of failure. Thus, the core challenge needs to provide a probability of success, on average, somewhere in the range of 40-60%.
The game developed to fulfil these requirements was a top-down shooter developed in Flash using Actionscript. While any simple action game based on a physical challenge with hit-miss scoring could be suitably modified for our purposes, a top-down shooter holds several advantages. Firstly, high familiarity with the style means the learning period for players is minimal, supporting our aims of using the game for experimental data collection. Secondly, the simple coding of key difficulty parameters (i.e. target speeds and accelerations) allows the reward structure to be easily and precisely manipulated. Lastly, a ‘shot’ of a top-down shooter is analogous to a ‘shot’ in basketball, with similar outcomes of ‘hit’ and ‘miss’. This forms a clear and identifiable connection between the current experiment and the origins of the hot hand.
In the top-down shooter, the goal of the player is to shoot down as many alien spaceships as possible within some fixed amount of time. This means the number of overall shots made, as well as the number of hits, depend on player performance and strategy. The game screen shows two spaceships, representing an alien and the player-shooter (Figure 1). The simple interface provides feedback about the current number of kills and the time remaining. During the game the player’s spaceship remains stationary at the bottom centre of the screen. Only a single alien spaceship appears at any one time. It moves horizontally back-and-forth across the top of the screen, and bounces back each time it hits the right or left edges. The player shoots at the alien ship by pressing the spacebar. For each new alien ship the player has only a single shot with which to destroy it. If an alien is destroyed the player is rewarded with a kill.

Figure 1: The playing screen.
Each alien craft enters from the top of the screen and randomly moves towards either the left or right edge. It bounces off each side of the screen, moving horizontally and making a total of eight passes before flying off. Initially the alien ship moves swiftly, but it decelerates at a constant rate, moving more slowly after each pass. This game therefore represents a variable difficulty task; a player can elect a desired level of risk as the shooting task becomes less difficult with each pass of the alien.
The risk and reward equation is quite simple for the player. The score for destroying an alien is the same regardless of when the player fires. Since the goal is to destroy as many aliens as possible in the game period, the player would benefit from shooting as quickly as possible; shooting in the early passes rewards the player with both a kill and more time to shoot at subsequent aliens. However, because the alien ship decelerates during each of the eight passes, the earlier a player shoots the less likely this player will hit the target. If a shot is missed, the player incurs a 1.5 second time penalty. That is, the next alien will appear only after a 1.5 second delay which is additional to the interval experienced for an accurate shot.
Stage One--Player Fixation
After self-testing the game, we deployed it so that it could be played online. Five players were recruited via an email circulated to students, family and friends. Players were instructed to shoot down as many aliens as possible within a given time block. They first played a practice level for six minutes before playing the competitive level for 12 minutes. The number of alien ships a player encountered varied depending on the player’s strategy and accuracy. A player could expect to encounter roughly 10 alien ships for every 60 seconds of play. At the completion of the game the player’s response time and accuracy were recorded for each alien ship.
Recall that one of the game requirements was that players take shots across a range of difficulty levels, represented by passes (later passes mean less difficult shots)--this simple test provides evidence that a player is willing to explore the search space and alter her or his risk-taking behaviour throughout the game. Typical results for Players one and two are shown in Figure 2. In general players tended to be very exploratory during the practice level of the game, as indicated by a good spread of shots between alien passes one and eight. During the competitive game time however players tended to invest in a single strategy, as indicated by the large spikes seen in the competition levels of Figure 2. This suggests that players, after an exploratory period, attempted to maximise their score by firing on a single, fixed pass.
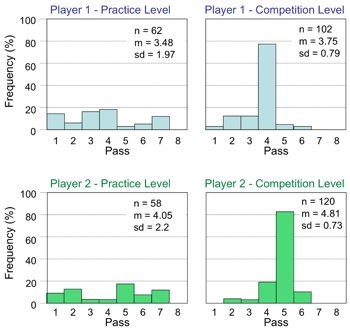
Figure 2: Results for two typical players in Stage one of game development. The upper row shows data for Player 1, and the bottom row shows data for Player 2. The left column presents the frequency (%) of shots taken on each pass in the practice level, while the right column indicates the frequency (%) of shots taken on each pass in the competition level. Note that players experimented during the practice level, as evidenced by evenly spread frequencies across passes in the left panels, but then adopted a fixed strategy during the competitive block, as evidenced by spikes at pass 4 (Player 1) and pass 5 (Player 2). For each panel, n is the overall number of shots attempted by the player in that block, m is the mean firing pass, and sd is the standard deviation of the number of attempted shots.
In experimental terms, this fixation on a single strategy is known as ‘investment’. At the end of the game the players reported that, because of the constant level of deceleration, they could always shoot when the alien was at a specific distance from the wall if they stuck to the same pass. Players thus practiced a timing strategy specific to a particular alien pass (i.e., a specific difficulty level). The number of kills per unit time (i.e., the reward) was therefore always highest for that player when shooting at the same pass. In the example graphs (Figure 2), one player ‘invested’ in learning to shoot on pass four, the other, on pass five. This type of investment runs counter to one requirement of a hot-hand game, creating a major design flaw that needed to be fixed in the next iteration.
Stage Two--Encouraging Exploratory Play
The aim of the second stage of design was to overcome the problem of player investment in a single strategy. The proposed solution was to vary the position of the player’s ship so that it no longer appeared in the same location at the centre of the screen but rather was randomly shifted left and right of centre each time a new alien appeared (Figure 3). Thus, on each trial, the shooter’s location was sampled from a uniform distribution of 100 pixels to the left or to the right of the centre. This manipulation was intended to prevent the player from learning a single timing-sequence that was always successful on a single pass (such as always shooting on pass four when the alien was a certain distance from the side of the screen).

Figure 3: The screen in Stage two of game development. The blue rectangle appears here for illustration purposes and indicates the potential range of locations used to randomly position the player’s ship. It did not appear on the actual game screen.
Once again we deployed an online version of the game and recorded data from six players. Players once again played a practice level for six minutes before they played the competitive level for 12 minutes.
The results for all individual players in the competitive game level are shown in Figure 4. Introducing random variation into the players firing position significantly decreased players’ tendency to invest in and fixate on a single pass. This decrease in investment is highlighted by the increase in the variance seen in Figure 4 when compared to Figure 2. Thus, the slight change in gameplay had a significant effect on players’ behaviour, encouraging them to alter their risk-taking strategy throughout the game. Furthermore, this change helps to meet the requirements necessary for hot hand investigation.

Figure 4: Individual player results for the competition level in Stage two testing. Player’s tendency to fire on a single pass in the competition level has been significantly reduced compared to Stage One, as evidenced by the reduction in spikes and, in most cases, increase in variance. For each panel, n is the overall number of shots attempted by the player in that block, m is the mean firing pass, and sd is the standard deviation of the number of attempted shots.
In Figure 5 we present data averaged across all players for both the practice and competition levels. This summary highlights how the game’s reward structure influenced player strategy throughout play. The left column corresponds to the practice level (not shown in Figure 4), while the right column corresponds to the competition level.
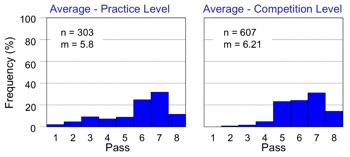
Figure 5: Average player results for Stage two. The left column presents the frequency (%) of shots taken on each pass in the practice level, while the right column indicates the frequency (%) of shots taken on each pass in the competition level. For each panel, m is the mean firing pass and n is the overall number of shots attempted by all players in that block. A comparison of mean firing pass for practice and competition levels highlights that as the game progressed, players fired later.
An inspection of Figure 5 highlights the fact that players’ shooting strategy altered in a predictable manner as the game progressed. For example, the mean firing pass for the practice level (m = 5.8) was smaller than that seen in the competition level (m = 6.21). Thus players tended to shoot later in the competition level. This suggests that the reward structure of the game was biased towards firing at later passes, and that as players became familiar with this reward structure they altered their gameplay accordingly.
Given the need to minimise such bias for hot hand investigation, we examined the risk and reward structure on the basis of average player performance. We were particularly interested in the probability of success for each pass, and how this probability translated into our reward system. Recall that firing on later passes takes more time but is also accompanied by a higher likelihood for success. As the aim of the hot hand game is to kill as many aliens as possible within a 12 minute period, both the probability of hits as well as the time taken to achieve these hits are important when considering the reward structure.
We therefore analysed how many kills per 12-minute block the average, hypothetical player would make if he or she were to consistently fire on a specific pass for each and every alien that appeared. For example, given the observed likelihood of success on pass one, how many kills would a player make by shooting only on pass one? How many kills on pass two, and so on. Results of this examination are reported in Figure 6. Figure 6A shows the average number of shots taken by players on each pass of the alien (overall height of bar) along with the average number of hits at each pass (height of yellow part of the bar). Figure 6B uses this data to plot the observed probability of success and shows that the probability for success is higher for later passes. This empirically validates that later passes are in fact ‘easier’ in a psychological sense.

Figure 6: Averaged results and some modelling predictions from Stage two of game development. In Panel A, the frequency (%) of shots attempted on each pass is indicated by the overall height of each bar. The proportion of hits and misses are indicated in yellow and blue. Panel B depicts the average probability of a hit for each pass, given by the number of hits out of overall shot attempts. Based on the empirical results, Panels C and D show the predicted number of successful shots if players were to consistently shoot on only one pass for the entire game (see text for details).
These probabilities allow empirical estimation of the number of total kills likely to be attained by the hypothetical average player if they were to shoot on only one pass for an entire 12 minute block. By plotting the number of total kills expected for each pass number, we produce an optimal strategy curve for the current game, as shown in Figure 6C. The curve is monotonically increasing, indicating that the total number of kills expected of an average player increases as the pass number increases. In other words, players taking less difficult shots are expected to make more hits within each game. The reward structure is clearly biased toward later passes, which validates the change in player strategy (i.e. firing on later passes) as the game progressed. As the players became accustomed to the reward structure, their strategy shifted accordingly to favour later, easier shots.
In game terms it might be considered an exploit to shoot on pass eight. Figure 6C indicates that consistently firing on pass 8 would clearly result in the greatest number of kills, making it the ‘optimal’ strategy for the average player. Given that an exploit of this kind reduces the likelihood of players to fire earlier in response to a run of successful shots, the current design still failed to meet the requirements for our hot hand game.
One simple adjustment to overcome this issue was to reduce the penalty period after an unsuccessful shot. While the current time penalty for a missed shot was set to 1.5 seconds, the ability to vary this penalty allows a deal of flexibility within the reward structure. Given that players make many more shots, and thus many more misses, if they choose to fire on early passes - decreasing the time penalty for a miss substantially increases the relative reward for firing on early passes.
In line with this thinking, Figure 6D shows the predicted number of kills in 12 minutes for the average player if the penalty for missing is reduced from 1.5 seconds to 0.25 seconds. This seemingly small change balances the reward structure so that players are more evenly rewarded, at least for passes three to eight. Estimation of accuracy rate on passes one and two were based on a small number of trials, which makes them problematic for modelling; participants avoided taking early shots, perhaps because the alien was moving too fast for them to intercept. Allowing for players to fire on passes three to eight still provided us with sufficient number of possible strategies for a hot hand investigation.
Stage Three--Balancing Risk and Reward
In stage two of our design we uncovered an exploitation strategy in the risk and reward structure of the game where players could perform optimally by shooting on pass eight of the alien. We suspect this influenced players to fire at later passes of the alien, particularly as the game progressed. Using empirical data to model player performance suggested that reducing the time penalty for a miss to 0.25 seconds would overcome this problem.
A modified version of the game, with a 0.25 seconds penalty after a miss, was made available online and data were recorded from five players. Averaged results show that players shot at roughly the same mean pass of the alien in the practice level and the competitive level (Figure 7). This pattern is in contrast with Figure 4, which highlighted a tendency for players to fire at later passes in the 12 minute competitive level. This data confirms the empirical choice of a 0.25 second penalty, and provides yet another striking example of how subtle changes in reward structure may influence players’ behaviour.
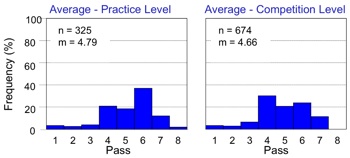
Figure 7: Average player results for Stage three of game development. The left plot presents the frequency (%) of shots attempted on each pass in the practice level, while the right plot indicates the frequency (%) of shots attempted on each pass in the competition level. For each panel, m is the mean firing pass and n is the overall number of shots taken by all players in that block. As indicated by the mean firing pass, under a balanced reward structure players no longer attempted to shoot on later passes as the game progressed.
Recall that we began the development of a hot-hand game with the requirement that for each level of assumed risk the game should be equally rewarding (total number of kills) for the average player. By balancing the reward structure, the design from stage three is now consistent with this requirement for investigating the hot hand.
Finally, we required the game to have an overall level of difficulty such that players would succeed on about 40-60 percent of attempts. Performance within this range would allow us to compare player strategy in response to runs of both success and failure. That is, testing for both hot and cold streaks. As highlighted by Figure 8, the overall probability of success does indeed meet this criteria; the overall probability of success (hits) was 43%. Thus, the game now meets the essential criteria required to investigate the hot hand phenomenon.

Figure 8: Averaged results from the competition level of Stage three of game development. In Panel A, the frequency (%) of shots attempted on each pass is indicated by the overall height of each bar. The proportion of hits and misses are indicated in yellow and blue. Panel B depicts the average probability of success for each pass, given by the number of hits out of overall shot attempts. In Panel B, ps is the overall probability of success (hits).
Discussion
We set out to design a computer game as a tool for studying a fascinating and widely studied psychological phenomenon called the ‘hot hand’ (e.g., Gilovitch, Valone, & Tversky, 1985). For this we needed a game that allowed us to investigate player risk-taking in response to a string of successful or unsuccessful challenges.
We designed a simple top-down shooter game where players had a single shot at an alien spacecraft as it made eight passes across the screen. During the game the player faced this same challenge a number of times. The goal of the game was to kill as many aliens as possible in a set amount of time. The risk in the gameplay reduced on each pass as the alien ship slowed down. Shooting successfully on earlier passes rewarded the player with a kill and made a new alien appear immediately. Missing a shot penalised the player with an additional wait time before the next alien appeared.
As a hot hand game it was required to meet specific risk and reward criteria. Players should explore a range of risk-taking strategies in the game and they should be rewarded in a balanced way commensurate with this risk. We also wanted the game challenge to have an average success rate roughly equal to the failure rate, between 40 and 60 percent so that we could use the game to gather data about player’s behaviour in response to both success and failure.
To achieve our objective we developed the game in an iterative fashion over three stages. At each stage we tested an online version of the game, gathering empirical data and analysing the players’ strategy and performance. In each successive stage of design we then altered the game mechanics so they were balanced in a way that met our specific hot hand requirements. The design changes and their effects are summarised in Table 1.

Table 1. A summary of changes to design in each of the stages and the effect of these changes on meeting the hot hand requirements.
Books on game design tend to prescribe an iterative design process. Iterative processes allow unforseen problems to be addressed in successive stages of design. This is especially important in games where the requirements for the game mechanics are typically only partially known and tend to emerge as the game is built and played. Salen and Zimmerman describe this iterative process as “play-based” design and also emphasise the importance of “playtesting and prototyping” (2004, p. 4). For this purpose successive prototypes of the game are required. Indeed we began with only high-level requirements and used this same iterative, prototyping approach to refine our gameplay.
The main difference in our approach is that we more formally measured player’s strategies and exploration behaviours in each stage of design. Given that our game requirements are rather unique, it is unlikely that subjective feedback alone would have allowed us to make the required subtle changes to game mechanics. For example, during the initial testing of the game we found that players tended to invest in a single playing strategy. Further analysis also revealed a potential exploit in the game as players could easily optimise their total number of kills by shooting on the last pass of each alien ship.
The issue of exploits in games is often debated in gaming circles and is also well studied in psychology. Indeed trade-offs between exploitation and exploration exist in many domains (e.g., Hills, Todd, & Goldstone, 2008; Walsh, 1996). External and internal conditions determine which strategy the organism, or the player, will take in order to maximise gains and minimise loses. For example, when foraging for food, the distribution of resources matters. Clumped resources lead to a focused search in the nearby vicinity where they are abundant (exploitation), whereas diffused resources lead to broader exploration of the search space.
Hills et al. showed that exploration and exploitation strategies compete in mental spaces as well, depending on the reward for desired information and the toll incurred by search time for exploration. In the context of our game, a shooting strategy of consistently attempting the easiest shooting level (pass 8) produced the highest reward. This encouraged players to drift toward later firing as the game progressed, and in turn inhibited players from exploring alternate (earlier firing) strategies. It is unlikely we could have predicted this without collecting empirical data from players.
A further advantage of gathering empirical data was that it allowed us to remodel our reward structure based on precise measures of player performance. In stages one and two players lost 1.5 seconds each time they missed an alien. In stage three we reduced this penalty to 0.25 seconds based on our analysis and modelling of player behaviour. This relatively minor change was enough to change players’ behaviour and encourage them to risk earlier shots at the alien. The fact that our game is quite simple in nature reinforces both the difficulty and importance of designing a well-balanced risk and reward structure.
Another common principle referred to in game literature is player-centred design which is defined by Adams as “a philosophy of design in which the designer envisions a representative player of a game the designer wants to create.” (2010, p. 30). Although player-centred design is often a common principle referred to in game-design texts there is some suggestion that design is often based purely on designer experience (Sotamaa, 2007). Involving players in the design process typically involve more subjective feedback from approaches such as focus groups and interviews which have been generally used in usability design. In our study, when designing even a simple game challenge it is clear that the use of empirical data to measure how players approach the game and how they perform can be another vital element in balancing the gameplay.
We also recognise some dangers with this approach, as averaging player performance can hide important differences between players. It would be nice to have a model of an ideal player but it is unlikely such a player exists. In fact there are many different opinions about who the ‘player’ is (Sotamaa, 2007). The empirical data therefore need to be gathered from the available players’ population. If there are broad differences among these players then it may require the designer to sample different groups, for example, a group of casual players and a group of hard-core gamers.
Importantly for future research, the game design at which we arrived is now suitable to investigate the hot hand phenomena. Such a game can potentially answer a number of questions:
1. How do players respond to a run of success or failure in a game challenge?
2. Will a player take on more difficult challenges if they are on a hot streak?
3. Will they lower their risk if they are on a cold streak?
4. How will this variable risk level impact on their overall measure of performance?
5. How can the hot hand principle be used in the design of game mechanics?
Answers to such questions will not only be of interest to psychologists, but could also further inform game design. For example, it might allow the designer to engineer a hot streak so that players would take more risks or be more explorative in their strategies. Of course in a game it might even be appropriate to use a cold streak to discourage a player’s current strategy. The game mechanics could help engineer these streaks in a very transparent way without breaking player immersion. Further investigations of the hot hand hold significant promise for both psychology and game design.
References
Adams E. (2010). Fundamentals of Game Design (2nd Edition). New Riders, Berkley, CA, USA.
Adams, R. M. (1996). Momentum in the performance of professional tournament pocket billiards players. International Journal of Sport Psychology, 26, 580-587.
Albright, S. C. (1993). A statistical analysis of hitting streaks in baseball. Journal of the American Statistical Association, 88(424), 1175-1183.
Bar-Eli, M., Avugos, S., & Raab, R. (2006). Twenty years of "hot hand" research: Review and critique. Psychology of Sport and Exercise, 7, 525-553.
Clarke, R. D. (2003a). Streakiness among professional golfers: Fact or fiction? International Journal of Sports Psychology, 34, 63-79.
Clarke, R. D. (2003b). An analysis of streaky performance on the LPGA tour. Perceptual and Motor Skills, 97, 365-370.
Clarke, R. D. (2005). Examination of hole-to-hole streakiness on the PGA tour. Perceptual and Motor Skills, 100, 806-814.
Dorsey-Palmateer, R., & Smith, G. (2004). Bowlers' hot hands. The American Statistician, 58(1), 38-45.
Gilden, D. L., & Wilson, S. G. (1995). Streaks in skilled performance. Psychonomic Bulletin and Review, 2(2), 260-265.
Gilovitch, T., Vallone, R., & Tversky, A. (1985). The hot hand in basketball: On the misperception of random sequences. Cognitive Psychology, 17, 295-314.
Hills, T. T., Todd, P. M., & Goldstone, R. L. (2008). Search in external and internal spaces: evidence for generalized cognitive search processes. Psychological Science, 19, 802-808.
Koehler, J. J., & Conley, C. A. (2003). The "Hot Hand" myth in professional basketball. Journal of Sport and Exercise Psychology, 25, 253-259.
Fullerton, T., Swain, C., and Hoffman, S. (2004) Game Design Workshop: Designing, Prototyping, and Playtesting Games. CMP Books. USA.
Salen, K. and Zimmerman, E. (2004). Rules of Play: Game Design Fundamentals. The MIT Press, USA.
Schell, J. (2008) The Art of Game Design: A Book of Lenses. Morgan Kaufmann Publishers. USA.
Smith, G. (2003). Horseshoe pitchers' hot hands. Psychonomic Bulletin and Review, 2003(10), 3.
Sotamaa O. (2007) Perceptions of Player in Game Design Literature. Proceedings of DiGRA 2007 Conference. pp. 456-465.
Thompson, J. (2007) The Computer Game Design Course Thames and Hudson, London, UK.
Tversky, A., & Kahneman, D. (1974). Judgement under uncertainty: Heuristics and biases. Science, 185(4157), 1124-1131.
Walsh, P. D. (1996). Area restricted search and the scale dependence of patch quality discrimination. Journal of Theoretical Biology, 183, 351-361.